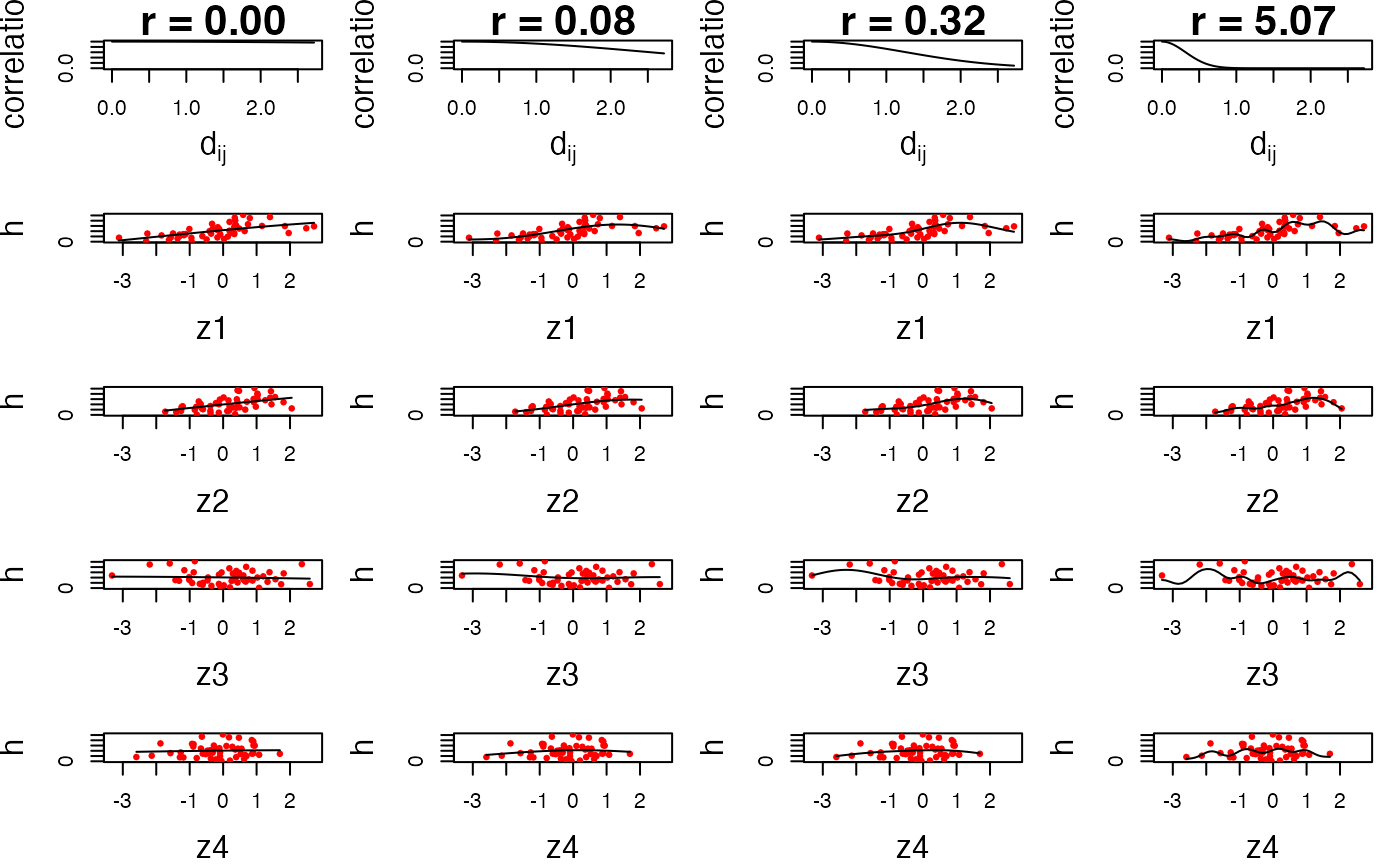
Plot of exposure-response function from univariate KMR fit
Source:R/InvestigatePrior_rm.R
PlotPriorFits.RdPlot the estimated h(z[m]) estimated from frequentist KMR for r[m] fixed to specific values
Usage
PlotPriorFits(
  y,
  X,
  Z,
  fits,
  which.z = NULL,
  which.q = NULL,
  plot.resid = TRUE,
  ylim = NULL,
  ...
)
Arguments
- y
a vector of outcome data of length
n.- X
an
n-by-Kmatrix of covariate data where each row represents an observation and each column represents a covariate. Should not contain an intercept column.- Z
an
n-by-Mmatrix of predictor variables to be included in thehfunction. Each row represents an observation and each column represents an predictor.- fits
output from
InvestigatePrior- which.z
which predictors (columns in
Z) to plot- which.q
which q.values to plot; defaults to all possible
- plot.resid
whether to plot the data points
- ylim
plotting limits for the y-axis
- ...
other plotting arguments
Examples
## First generate dataset
set.seed(111)
dat <- SimData(n = 50, M = 4)
y <- dat$y
Z <- dat$Z
X <- dat$X

priorfits <- InvestigatePrior(y = y, Z = Z, X = X, q.seq = c(2, 1/2, 1/4, 1/16))
PlotPriorFits(y = y, Z = Z, X = X, fits = priorfits)